
Let Them Eat Cake
Recipients of public aid are not passive beneficiaries. They are people with a surprisingly high level of agency, who can turn our ideas of consumption upside down.

People who are trying to save money don’t go to nightclubs every weekend.
A friend said that to me. We were discussing another friend of ours who had been cut off by his conservative parents because they didn’t approve of his girlfriend, who he intended to marry. Not one to back down, he promptly moved out of his parents’ house, got a less-than-ideal job and started living on his own. The plan was to save up enough money to get as far away from his extended family (imagine a large, wealthy, patriarchal family you’d typically see in an Ekta Kapoor serial) as possible, which meant moving abroad.
We were, of course, sympathetic. But my friend did not seem to have a good grasp on his own financial reality. His lifestyle did not change. Maybe, underneath all the drama, he knew that he could always count on his parents (if not his uncle—who we had so far pictured like an Alok Nath, but now he was an Amrish Puri). Nevertheless, he could at least have acted like someone who’s been cut off. And we judged him for it. It wasn’t until much later that I realized that perhaps the judgment was a little hasty. I myself had, more than a few times, acted just like that, although not for reasons that had—thank heavens—anything to do with family drama on a daily soap scale.
I studied in Pune and my first job took me to Mumbai. After years of staying in a hostel (my parents would have preferred “pigsty”, which was a dig at me, not the hostel), I would finally live like a respectable adult in a metro. I had learned to live frugally in college, and now, suddenly there was guilt-free money. It did not bother me that I was paying a criminal rent for half a bedroom in Powai. After all, I had managed to get a job at Enthought—the organization that was the Times Square of my area of interest. If you stayed there long enough, you’d run into everyone who mattered in the field of scientific computing. It was three years before we realized that we didn’t have to stay in Powai—our MD was a professor at IIT Bombay, and he agreed that we could easily move to a much cheaper place. So Enthought India packed up and left for Pune.
But even after three years of Mumbai, I had little to show for it financially. Other than the annual PPF contributions, I had no savings or investments. I had been reluctant to ask for a raise. Honestly, I was thankful to even have the job I did—there were exactly three people in the entire company who had less than postgrads, and I was one of them. The other two were legendary programmers in their own right, and I was merely a dabbler. So ultimately, after rent, food, transport and the utilities, I had very little left over. The only thing I could do with a few thousand rupees a month was... nightclubs every weekend. Even a couple of years after I left that job and started freelance consulting, when clients were hard to come by there wasn’t a regular paycheck, I was often careless with whatever little money I had. It was my partner who housed, clothed and fed me—and I was happy to let her do so. My own money went into comic books, video games and... nightclubs every weekend. It would be some time before I got wiser with money.
None of this is to say that I understand destitution—not by a long shot. As I write this, I am reminded of a particularly tone-deaf 2016 article on the “Urban Poor”—one the pitiable condition of millennials who don’t make enough money to be able to keep up appearances. Once you become aware of your privilege, you can only laugh at the idea.
I always knew I had a thick and durable safety net and a ton of privilege. But I have a distinct feel for the financial shortsightedness and irrationality that comes with not having disposable income.
It is precisely this kind of irrationality that breaks economic models. As money gets tighter, people seem to spend less and less reasonably. But what seems like unreasonable spending to the untrained eye often has very interesting, and sometimes, heartbreaking explanations... as we shall see.
दरिद्रता में जो एक प्रकार की अदूरदर्शिता होती है, वह निर्लज्जता के तकाजे, गाली और मार से भी भयभीत नहीं होती
—Munshi Premchand, Godaan
The Moral Hazard
The idea for this edition of Being Bayesian came from a recent column by Dr Shamika Ravi, in which she wrote that increasing public healthcare might be at odds with the increasing consumption of intoxicants. Drawing from HCES, she concluded that the poorest 40% households in India spend only 2.5% of their budget on education, but 4% on pan, gutkha, tobacco and other intoxicants. She quotes more numbers on how the consumption of intoxicants has increased by 33% in just over a decade. And sure enough, resources that were published before the 2023-2024 survey mention that paan and tobacco consumption has been declining1.
When we additionally consider the steadily rising enrolments in the Ayushman Bharat Yojana, Ravi and her colleagues have a good point. A naked-eye reading of the situation seems straightforward:
the poor are more likely to be insured, and
they are also more likely to eat more gutkha, and
since tobacco leads to non-communicable diseases whose costs increasingly fall on the state,
we have a classic case of moral hazard.
One line in the column, however, threw me off.
What makes the current moment particularly fraught is the interaction between rising tobacco use and expanding public healthcare coverage.
The problematic word here is “interaction”. On closer inspection, we see that the article simply juxtaposes two trends, assumes an interaction and invokes moral hazard. Thankfully, the HCES also records for each respondent household whether they have a member who is enrolled in PMJAY or a state-specific healthcare scheme, and whether they received healthcare benefits.
So I went looking for the interaction between intoxicants and public health coverage.
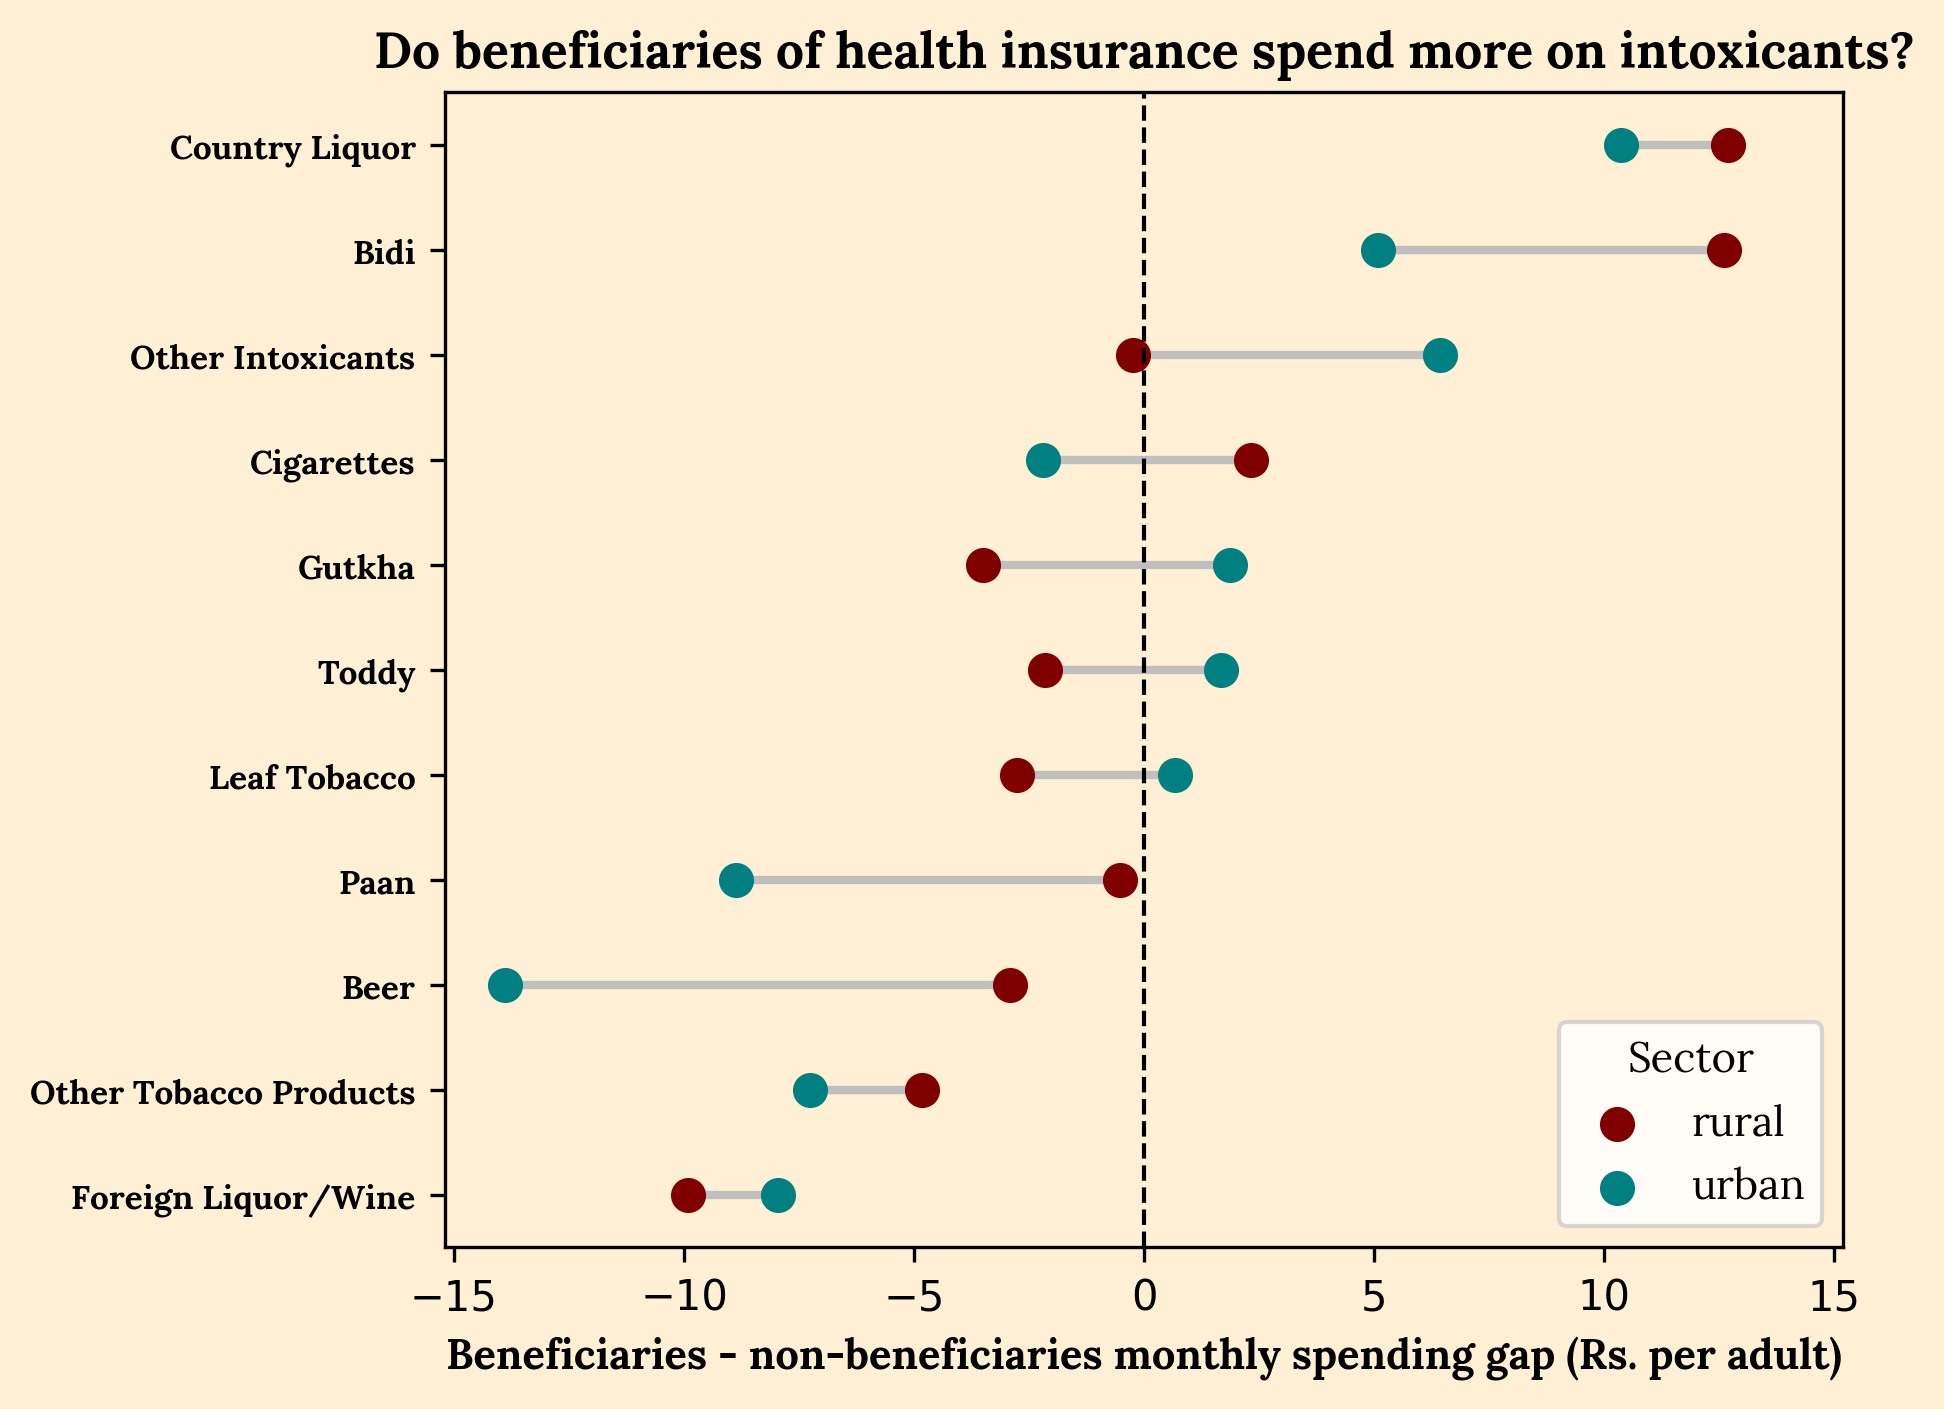
There’s barely any interaction. The difference between the consumption of intoxicants by beneficiaries of public healthcare, and that of non-beneficiaries, is negligible. For gutkha in particular, the urban beneficiary spends an average of 2 rupees per month more than the urban non-beneficiary, whereas the rural beneficiary spends 4 rupees less than the rural non-beneficiary. The entire chart spans only a difference of +/- Rs 15.
Of course, this does not mean that the moral hazard concerns are invalid. But it does suggest that we need some nuance. People’s worries about recipients of welfare becoming freeloaders often pop up in public discourse, but often without the slightest nuance2. Examples range from news anchors exasperatedly asking how long the middle classes can be expected to subsidize the poor3; to the chronic criticism of pre-election “revdis”, to entrepreneurs claiming that the gig economy will finally free the poor from handouts.
The simplest explanation for why this is such a bone of contention is that welfare in general doesn’t seem to work, much less for a country like ours. The implementation of a welfare scheme must navigate the labyrinth of social, cultural and systemic barriers to make its results visible. Abhijit Banerjee and Esther Duflo wrote an entire book, Poor Economics, showing that there’s no silver bullet to solve poverty4. As such, large, nationwide results are often disappointing. But with a little nuance, and if we know where to look, we can see small, but interesting effects.
Looking Inside the Basket
Of all the indicators of welfare schemes that appear within the HCES, I’ve chosen five: free electricity, LPG subsidy, state or central health insurance, midday meals and PDS. For each of them, I’ve looked at their effect on food and education. This choice is motivated mostly by convenience and simplicity. The survey questionnaires of both food and education are simple enough that I can construct a consumer basket for each household, and then compare the baskets of beneficiaries and non-beneficiaries. I’ve added details of the analytical method in a later section.
Broadly, for each type of aid, we first find how the food budget of a beneficiary household differs from that of a non-beneficiary household. Then we do the same for education. If we were to look at nationwide averages, the results are unsurprising, if a little disappointing.
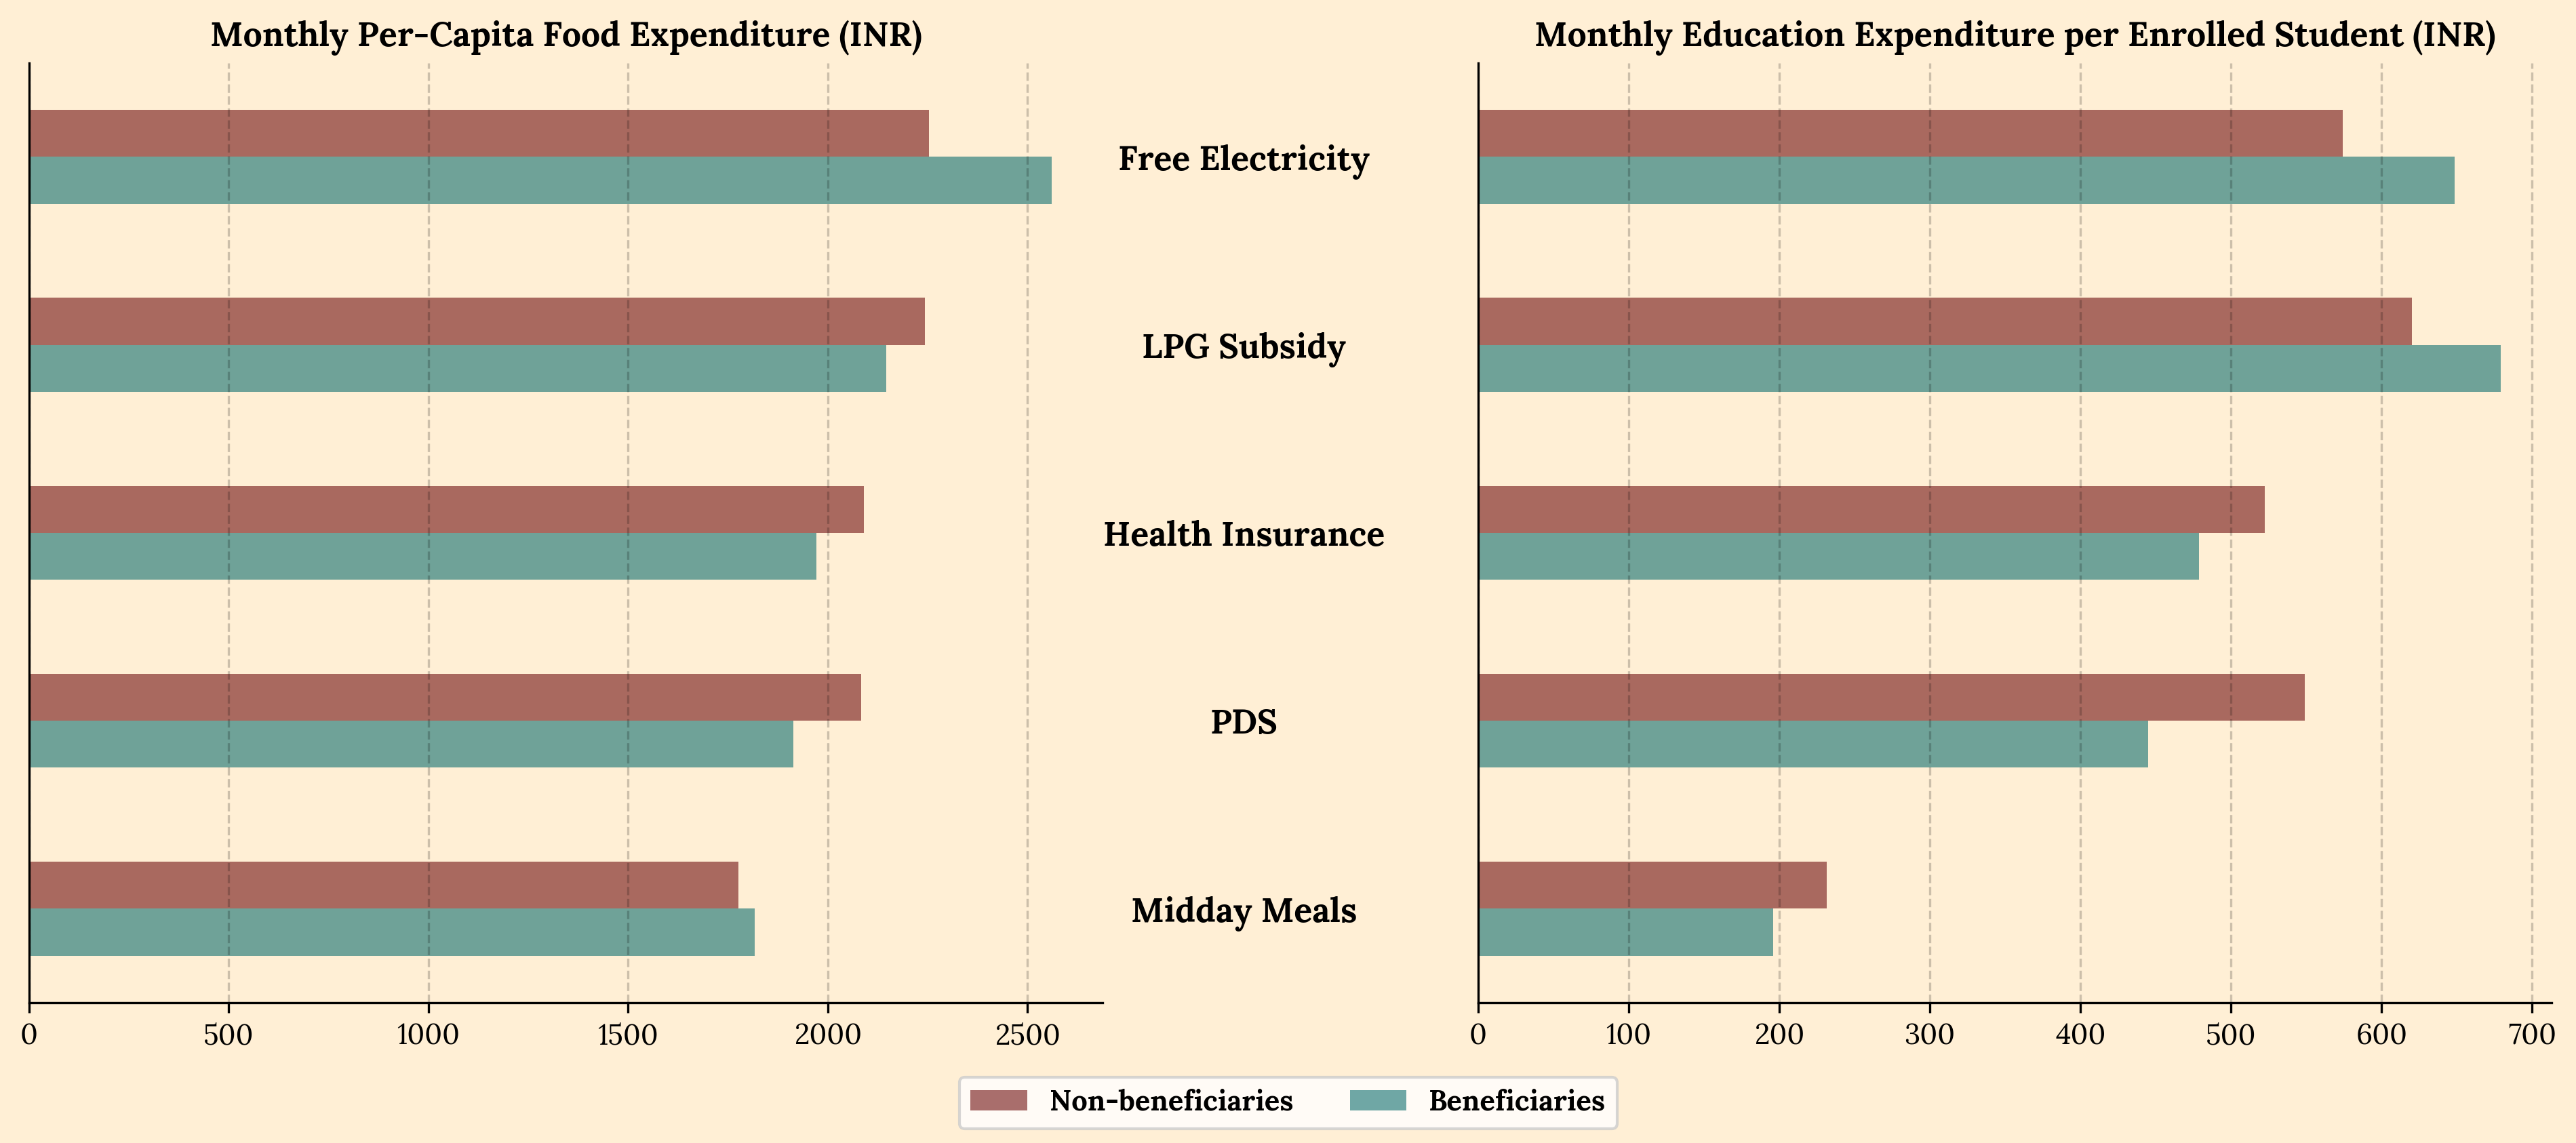
As expected, beneficiaries of almost every scheme spend less on food and education than their non-beneficiary counterparts. This is not surprising because the schemes are targeted at the poor, who spend less on almost everything. In fact, only free electricity gives beneficiaries an edge in both food and education. But the effects are small: households that receive free electricity spend only a few hundred rupees more on food, and less than a hundred rupees more on education. LPG subsidy, too, gives a tiny boost to education, amounting to less than a hundred rupees per student. In a sense, the differences are somewhat obvious. If beneficiaries were spending more than non-beneficiaries, that would perhaps be an indication of failed targeting.
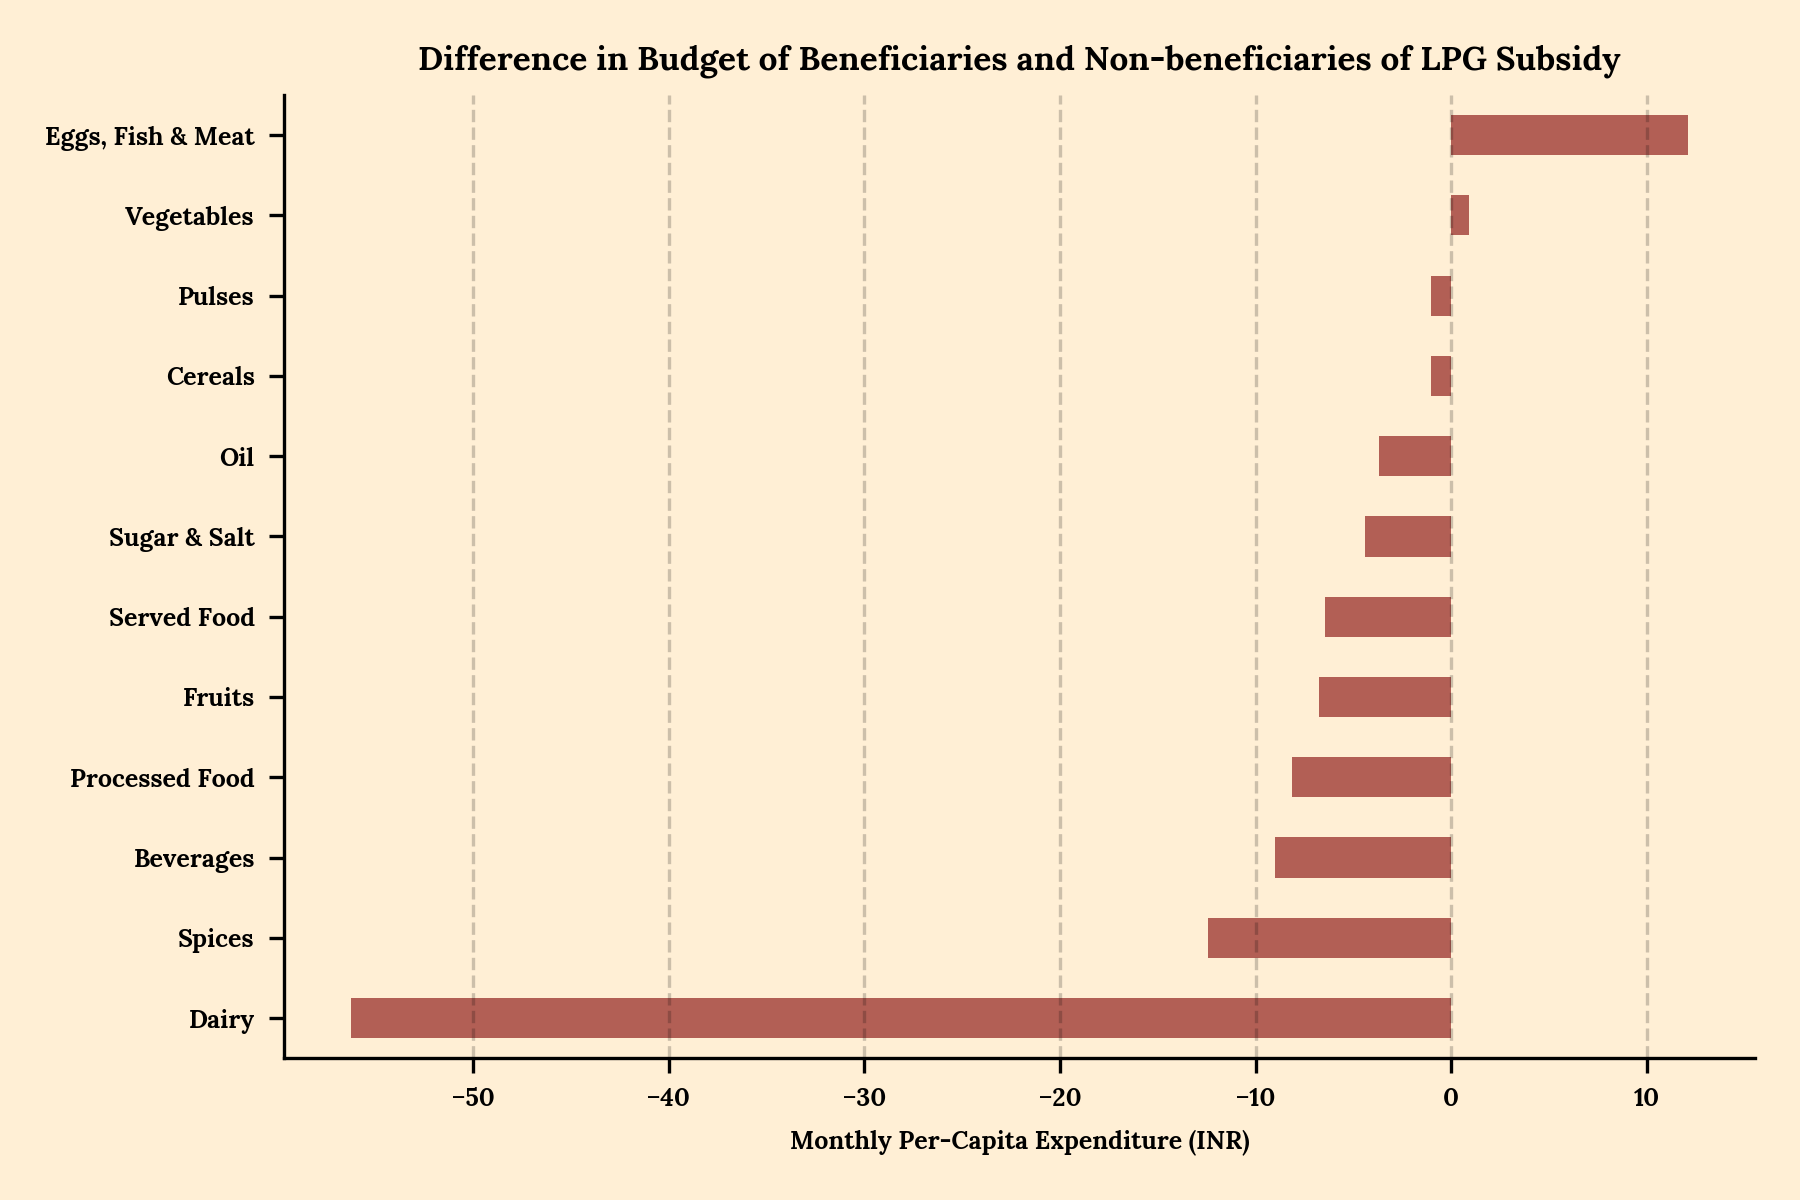
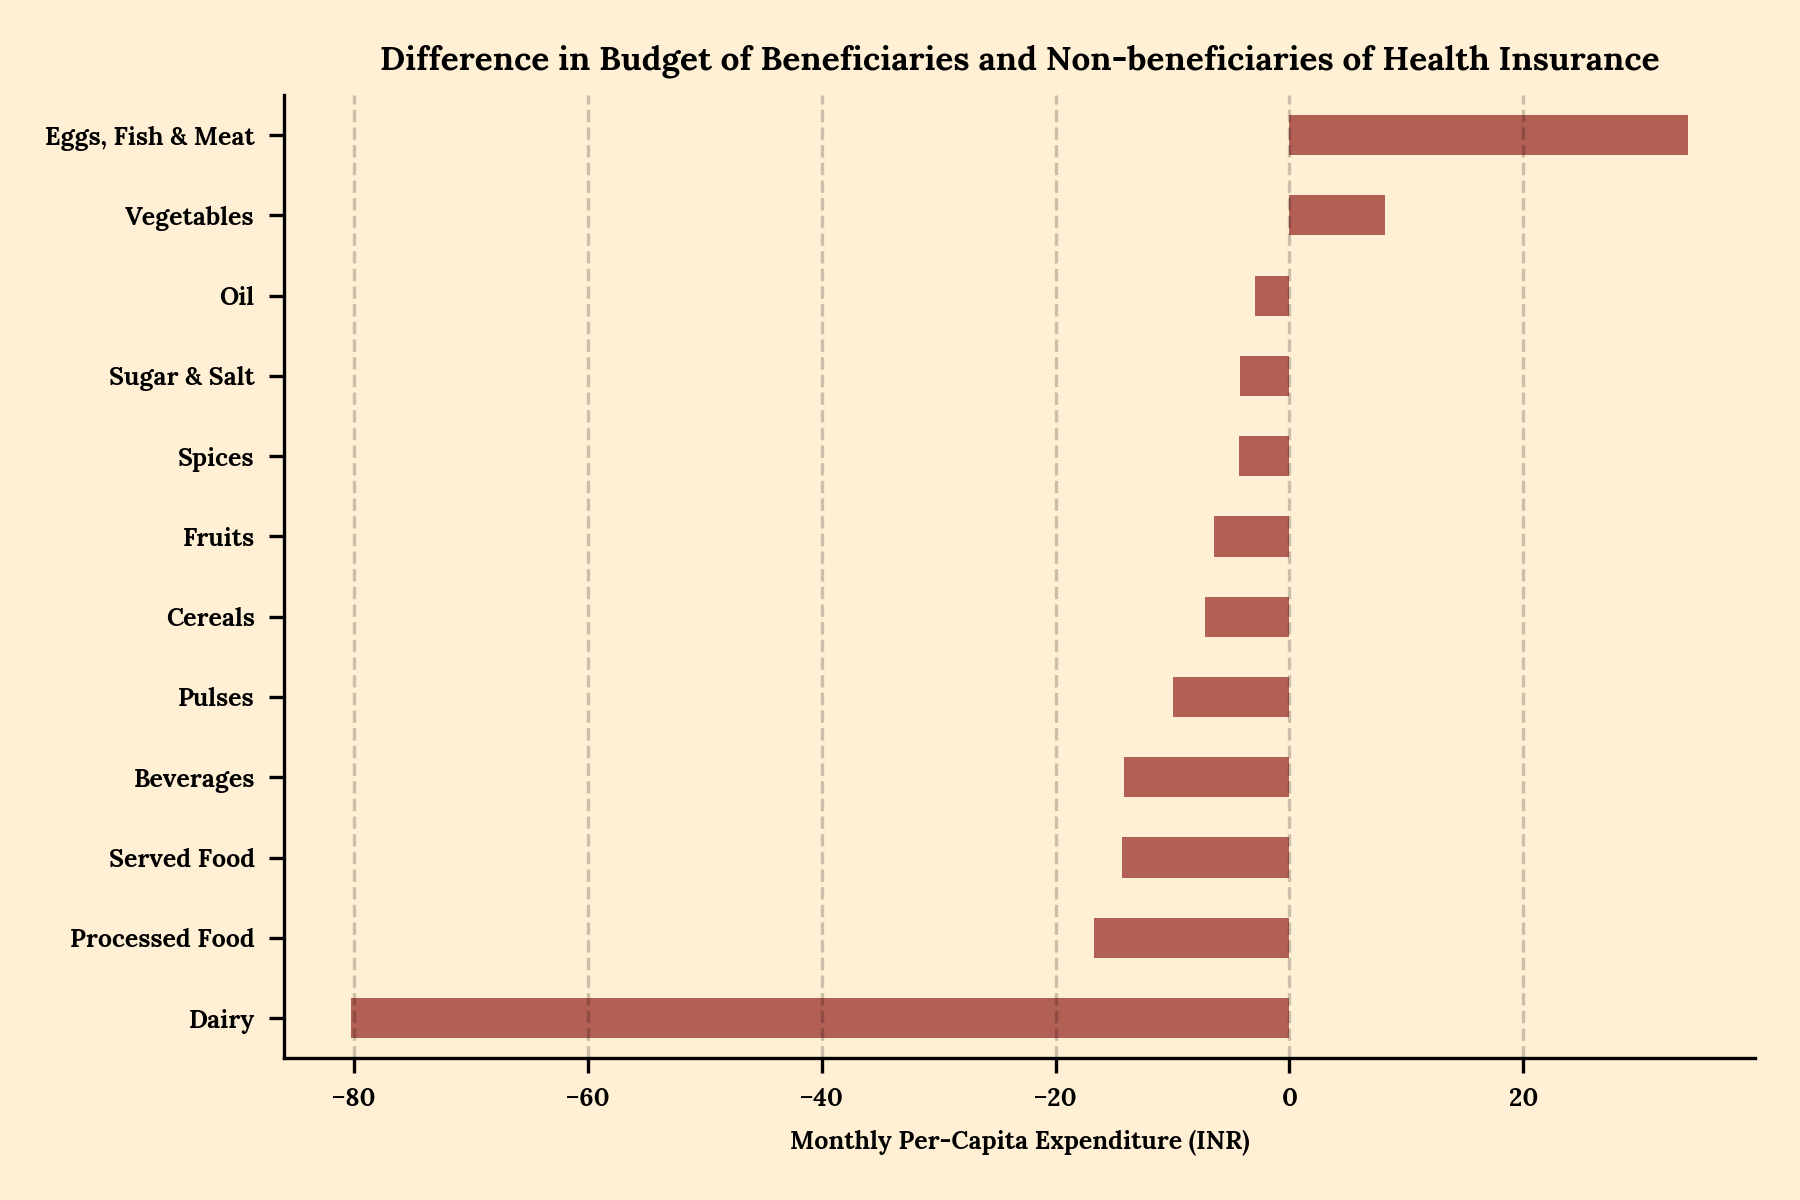
Held at this level of national abstraction, the numbers don’t tell us anything we don’t already know. But if we dig into the finer details of food and education, we see something interesting. For example, consider the pair of bars denoting the food expenditure associated with PDS (in the left column, the second pair of bars from the bottom). The difference in expenditure here is only Rs 168. But let’s look at how this difference is distributed between people who get subsidized rations against those who don’t.
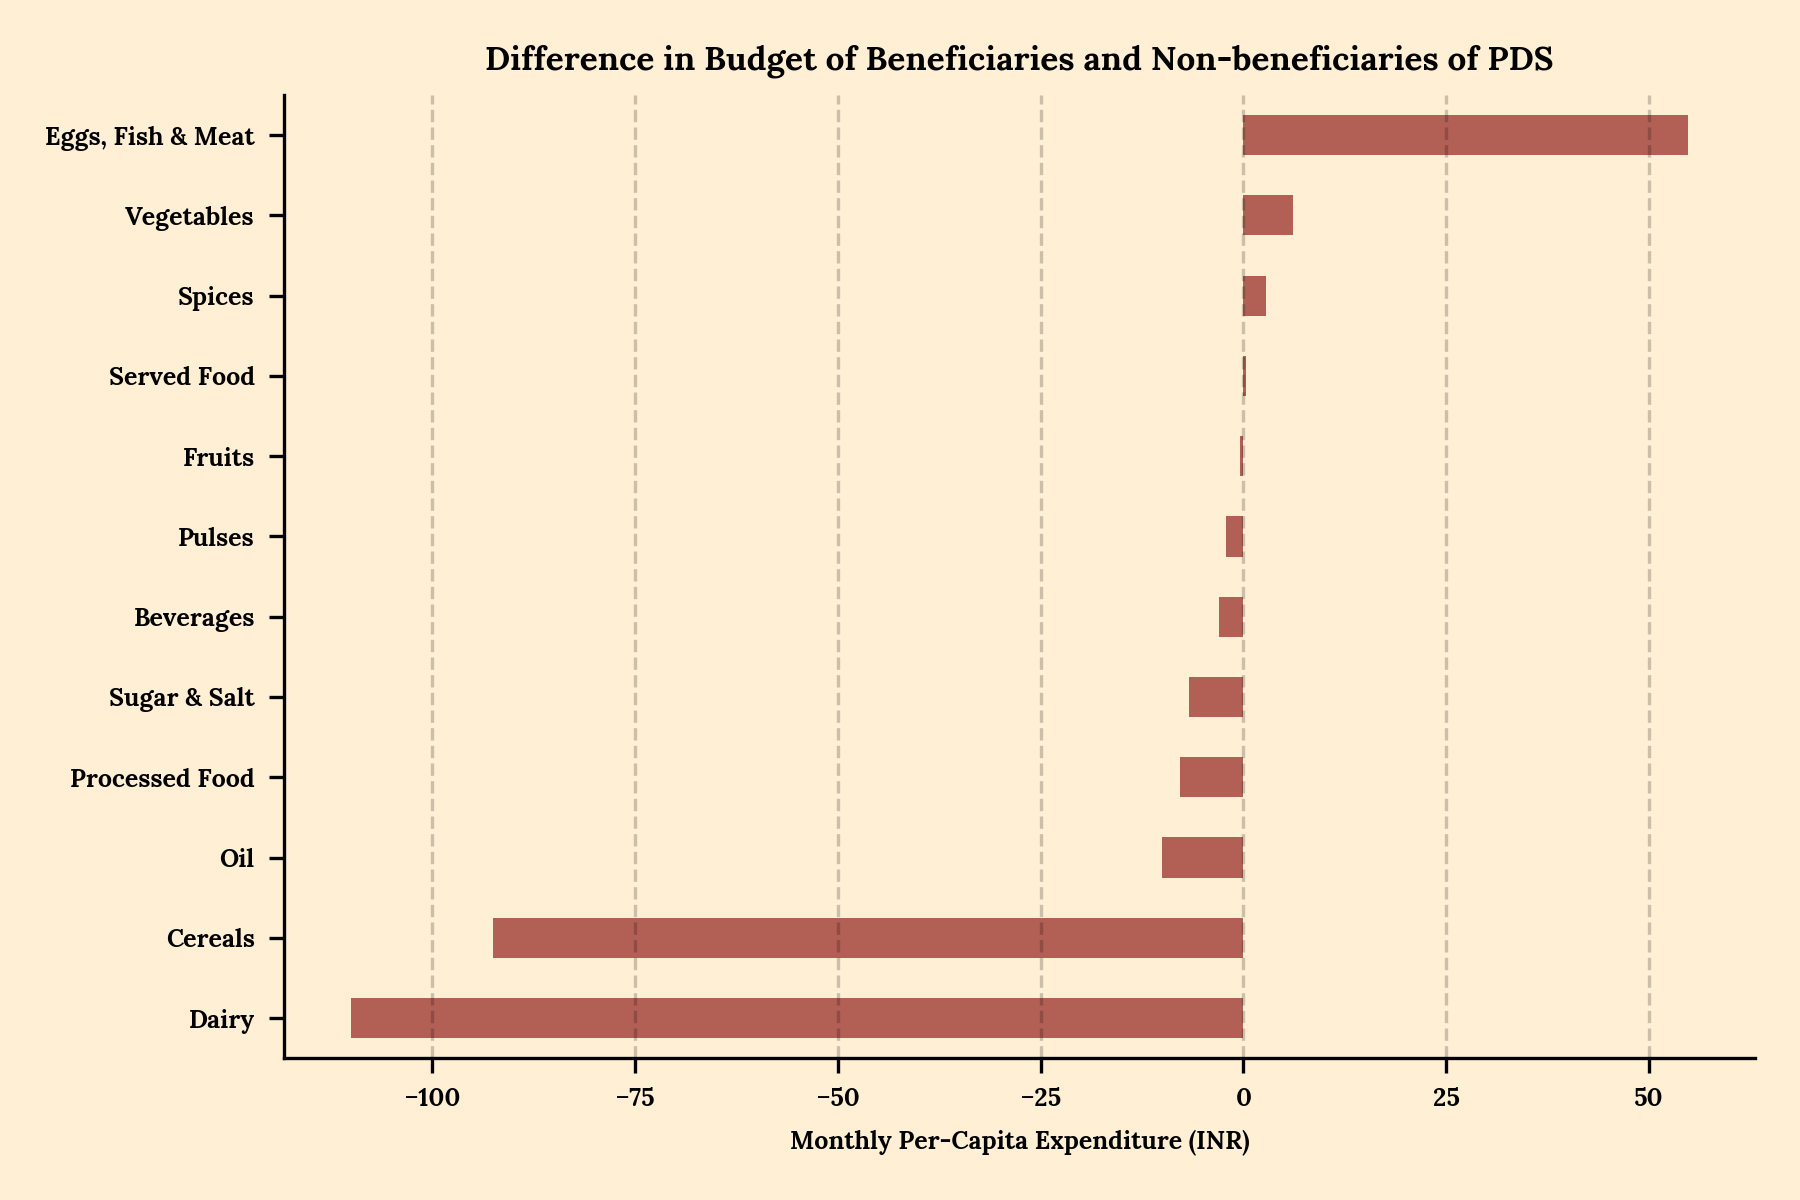
The average PDS beneficiary consumes nearly Rs 100 worth of dairy less than their counterpart, and also less cereals. But they also eat Rs 50 worth more of eggs, fish and meat. This pattern of less dairy and a little more meat repeats in LPG subsidies as well as public healthcare. Moreover, the positive spend on meat survives even when we break it down by religion and caste. It’s not like a subset of beneficiary households are eating more meat and pushing the average up. Among every caste and religion (with the exception of Sikhism), recipients of aid eat more meat than non-recipients.
At first, I thought this might be a calculated reallocation of the food budget—when people don’t have to worry about carbs, they can afford more protein. But there’s a more interesting explanation. Banerjee and Duflo write,
... the money that people spend on food is not spent to maximize the intake of calories or micronutrients. When very poor people get a chance to spend a bit more on food, they don’t put everything into getting more calories. Instead, they buy better-tasting, more expensive calories5.
They further cite a study6 which found that households which receive subsidies for cereals consumed less of them, and ate more meat.
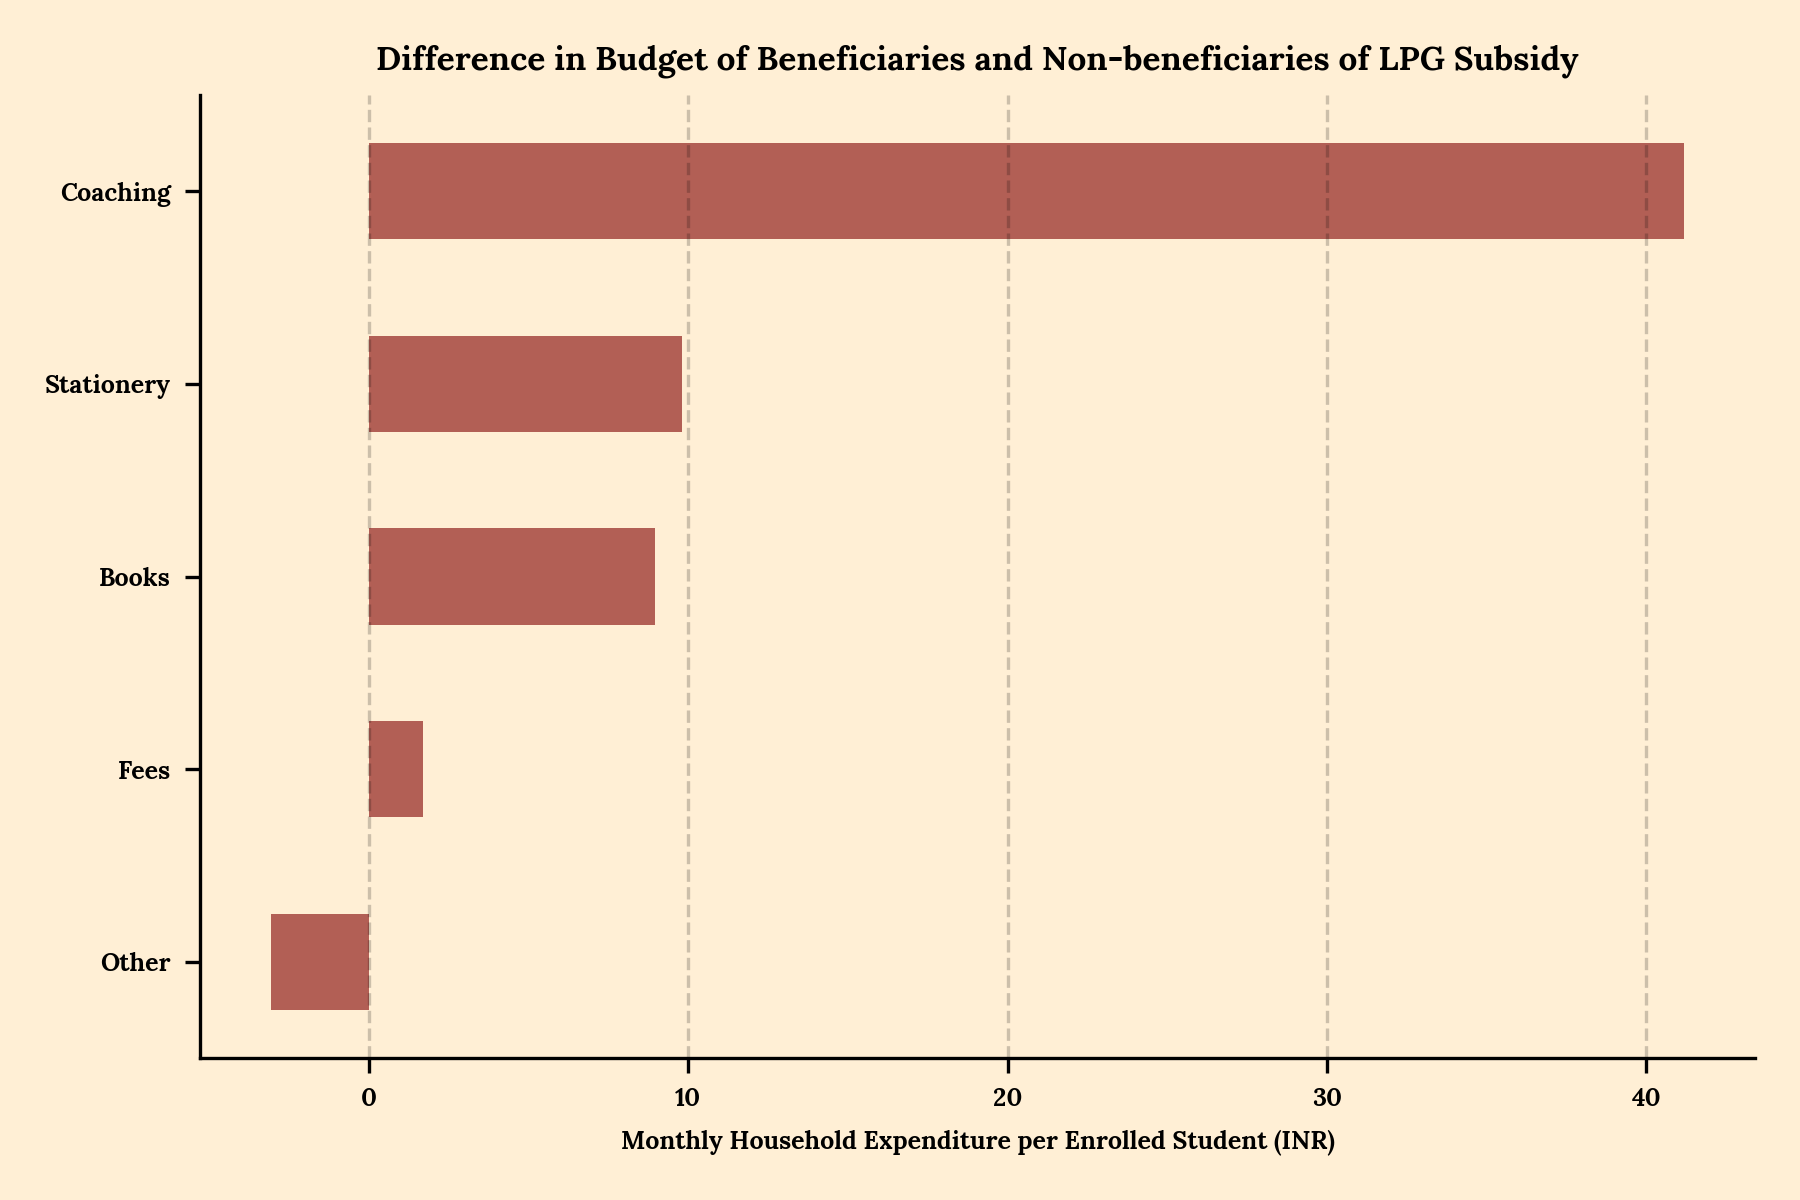
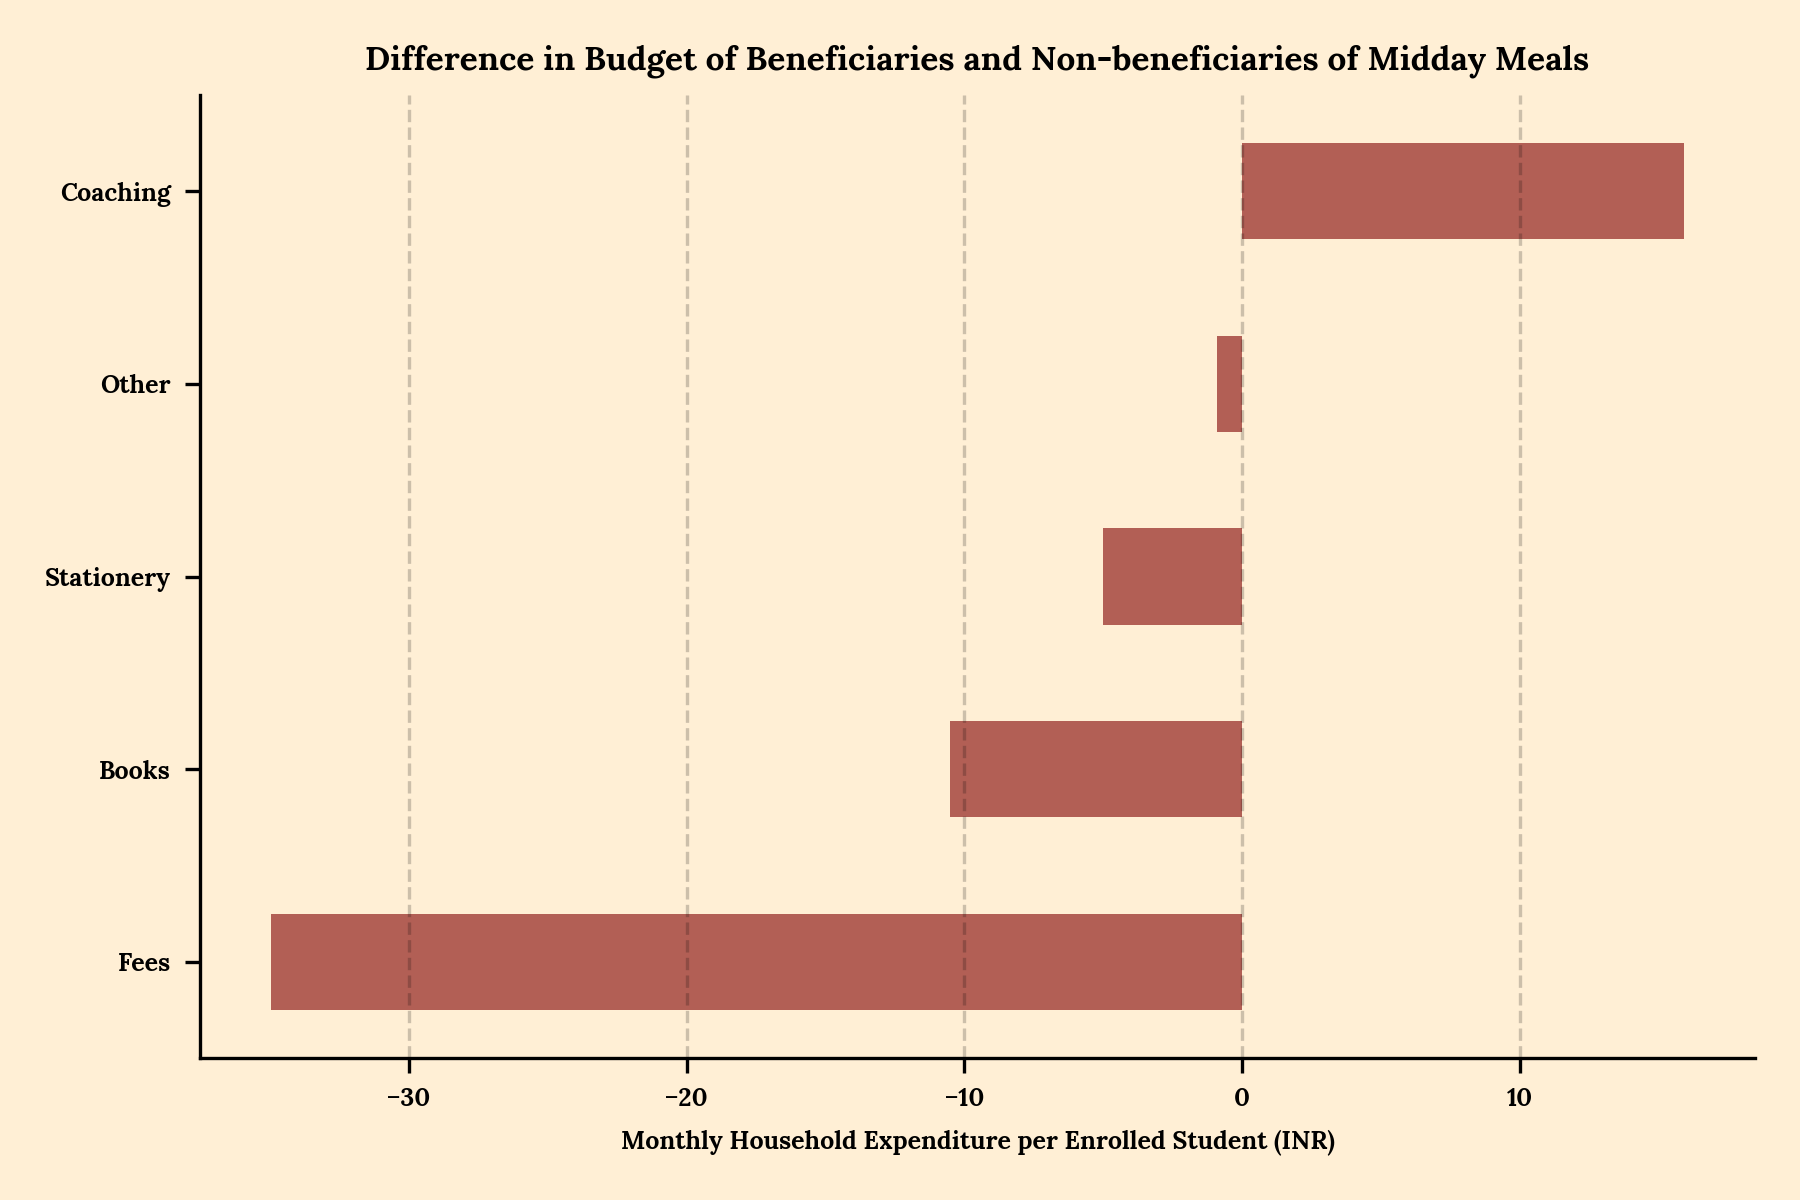
In education, too, we see a peculiar trend. Note that LPG subsidy is one of the only two interventions that gives a modest education spend among beneficiaries. For every student from a household which receives LPG subsidy, nearly Rs 60 is spent more on education than for a student from a non-beneficiary household. But of those 60 rupees, two-thirds goes to private coaching. Similar effects are seen for students who get midday meals at school, even if the effect is smaller in size.
We could keep on doing these experiments endlessly—create treatment and control groups and look at the differences in their spending patterns. For public welfare, we’d expect the treatment group to spend less on almost everything, but there would be some interesting buckets where the difference flips. It’s very tempting to come up with stories on why the sign flips for particular items; but rigorous explanations are best left to people who do field work. I may try to hunt down some such explanations in a later edition.
For now, the takeaway is simple: the effects of welfare rarely show up in the aggregate, but they do appear in specific pockets of consumption.
More than the Daily Bread
In the very first chart, beneficiaries of public healthcare spend slightly more on country liquor than those who are not beneficiaries. The difference is tiny—barely a few rupees a month—but it exists.
Years ago, a friend of mine worked at a microfinance firm. In his spare time he volunteered to teach the children of migrant labourers who lived near construction sites and factory grounds. Many of the parents worked long days carrying cement, bricks and steel—backbreaking labour that left their bodies permanently bent and scarred. Their food was poor, often lacking even basic nutrients. By nightfall their shoulders and backs would be in excruciating pain.
Sleep was almost impossible. The only thing that could knock them out was alcohol. It was not an indulgence—it was something that helped them work the next day. And they knew they were killing themselves. They had no choice.
Surveys or even field work alone cannot tell us everything about how welfare works. But they do offer a glimpse of something that public debates often miss: when even a small margin opens up in a household budget, people do not suddenly become irresponsible or extravagant. They simply make choices—sometimes careful ones, sometimes imperfect ones—much like anyone else would.
And sometimes, when the budget loosens just a little, those choices include something slightly nicer than before—better food, a little coaching for a child, or simply a way to get through the night and return to work the next morning.
Not cake, but something slightly better than bread.
Acknowledgements
I am highly indebted to Prof Vimal Kumar for asking me to ensure that comparisons are made only between households that are comparable, to Prof Ashwini Deshpande for showing me how to do so, and to Prof Reetika Khera, for convincing me that looking for the impact of welfare is going to take more than a few weeks and a Substack post.
Notes on the Analysis
The findings here are obtained by loosely imagining welfare interventions as randomized controlled trials—“loosely” being the operative word. Actual RCTs are expensive and take a very long time to conduct. The Household Consumption Expenditure Survey (HCES), on the other hand, gives us observations for sample households. No matter how we spin the data, it can’t exactly mimic the conditions of an RCT. The HCES contains nationally representative observations of households, but participation in welfare programs is not randomly assigned. The household characteristics certainly are not controlled, and the outcomes (which are, in this case, expenditure on and consumption of various goods and services) cannot be meaningfully linked to a trial intervention. As such, we lose causality, and limit ourselves to infer only associations. It’s true that correlation isn’t causation, but it’s not nothing. A friend used to say that throwing correlation away just because it’s not causation is like throwing the baby out with the bathwater.
So we end up with tenuous simulations of RCTs. We imagine welfare schemes as interventions, with each scheme having a fixed eligibility criterion. Based on this, we create a cohort of eligible households which we divide into “treatment” and “control” groups. For example, if we consider PDS as the intervention, then every household that has a ration card is eligible. Households that actually used the card to purchase subsidized goods end up in the treatment group. Instead, if the intervention is midday meals, then the eligibility changes to households that have children enrolled in public schools. Thankfully, much of this information can be found readily in the HCES.
The eligibility for healthcare interventions, however, was a little different from the other interventions. I have included households that had at least one member who was enrolled in Ayushman Bharat or a state-specific healthcare scheme, provided that nobody in the household had been hospitalized in the last year. In this sense, we only get to see if people view health insurance as a safety net. An actual health shock would have rendered households uncomparable, since I would have no way of controlling for its severity and duration, or its financial and emotional impact on the household.
However, eligibility alone is not enough; households must also be comparable in the socio-economic sense. Even without any intervention, consumption patterns vary widely. Household size, number of children and elderly members, religion, caste, and geography all influence what people buy. For example, a Dalit household in Vidarbha is bound to eat very differently from one in coastal Maharashtra, even if both are in the same state. So the eligible cohort needs to be further filtered down to only include households that are similar along observable socio-economic characteristics to each other, except for the intervention itself. We use a method called propensity score matching, which estimates the likelihood of a household receiving an intervention based on various attributes. Using the estimated propensity scores, we limit the analysis to households that have more than a 60% chance of being selected in a program (the top two quintiles of the PSM scores), and then we divide them between those that received the treatment and those that did not.
All numbers you see here are the differences in average expenditure between such cohorts, and the comparisons are statistically significant at the 5% level. The code and data needed to reproduce these results are available here.
Rukmini S., Whole Numbers and Half Truths, p.101. The book notes that paan and tobacco consumption in India has been declining over time, even though alcohol consumption has been rising.
In the research, there is no evidence that aid turns the poor into freeloaders.
Harsh Mander, Ash in the Belly, p. 290. Chapter 17: The End of Indifference
Abhijit Banerjee and Esther Duflo, Poor Economics. The book argues that poverty persists because it is shaped by multiple interacting constraints rather than a single cause.
Ibid, p. 32
Ibid, p. 34
wow. i cannot write in words the feeling that I experience when I read something that is in my set of "unknown unknowns" and which then significantly changes the model with which I look at the world.
thank you so much sir for this.
also, if it's ok, can you please share which courses/college you have pursued.
Great read. I don't have full understanding of the HCES dataset, but I imagine the households sampled are across economic strata. And assuming that a high percentage of eligible households would actually enroll for the welfare scheme, how are you ensuring the control group of non-beneficiaries belongs to the same economic group? Otherwise, how much of these results and inferences are attributable to the economic differences between the two groups - unaffected or modified by the welfare scheme intervention? For some welfare schemes electricity subsidy, comparison between states that offer the same and others that don't, might be a way?
The underlying premise which is being investigated, on whether incremental disposable income in the hands of households that typically don't have any, produces irrational decisions - is quite intriguing. Optimising for long term benefits is predicated on trust or faith in the probability of long term success. Apart from other things, the quantum of the welfare benefit and the individual's trust in the continued availability of the incremental disposable income and ability to make the sustained investments for long term benefits to see the payoffs should influence choices. So they would be very rational - just the goals and the benefits that are optimisation targets are different. I suspect it would be more instructive to see this as a game of strategy where the game is repeated and see how the choices evolve.